


 8 / 18

2.
ST. ANDREW EAST RURAL
St. Andrew East Rural is the second largest constituency in the parish with a population of 58,880,
according to the 2011 National Census; and of this number 40,726 are 18 years and older. This
constituency that borders St. Thomas has a voter turn-out of an average of 61% in the last 6 elections.
Calculations from the data collected suggest that the voter turn-out could swell as high of 71% in the
upcoming election.
History
St. Andrew East Rural is best described as a PNP seat that has had occasional political mood swings,
especially if there is a national social upheaval. The seat was created in 1959 and has had 12contested
elections, 8 won by the PNP and 4 by the JLP. In 1959 Keble Munn of the PNP won by 1519 votes and
later in 1962 more than doubled his margin of victory. In 1967 David Lindo of the JLP managed to secure
the seat for the JLP with a margin of 713 votes; but the PNP took back the seat in 1972 with Eric Bell.
The PNP under Roy McGannstrengthened the PNP’s hold on the seat until the violent election of 1980,
which was won by the JLP’s Joan Gordon. However, she was removed in the next contested election in
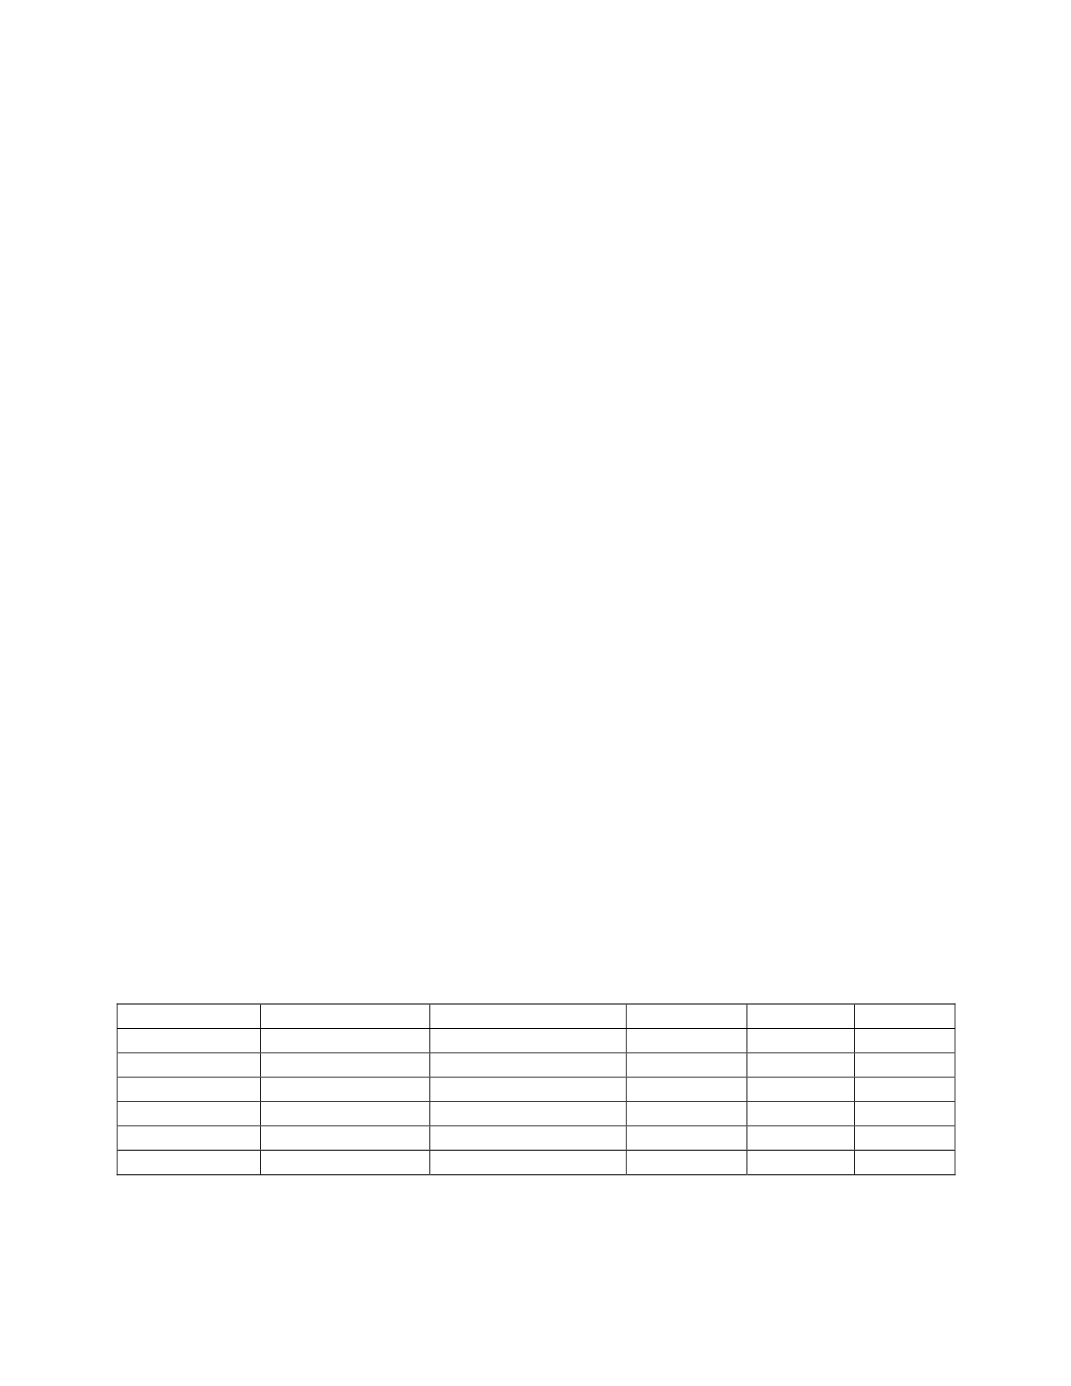
1989. Table 3 shows that the PNP kept the seat until 2002 when Horace Clue was beaten by Joseph
Hibbert. In 2011 Damion Crawford won the seat in a dramatic revival of the PNP.
The data in Chart 6 show thatthe PNP usually strengthen their hold on the seat whenever they win it –
but this is not the case for the JLP. The first consolidation occurred between 1959 and 1962, the second
between 1972 and 1976, and the third between 1989 and 1993 – with a decline following. The JLP had
their only consecutive wins in 2002 and 2007, but unlike the PNP, they did not strengthen their position.
It was therefore no surprise that Damion Crawford was able to reclaim the seat for the PNP in 2011,
despite a short campaign.
If the JLP should win the seat in the upcoming election, it would be a major
fracture of the timelines in Chart 6.
Note that the JLP and PNP percentages do not always add up to
100% as there are cases where there is a third candidate.
Table 3: PNP Dominance over the Past 6 Elections
Year
Winner
Loser
Turnout
% winner
% Loser
1989
EGG Barrett
Joan Gordon-Webley
73.64
51.40
48.60
1993
Horace Clue
Rudyard Spencer
60.92
60.67
32.24
1997
Horace Clue
Oswald Harding
57.65
53.66
38.20
2002
Joseph Hibbert
Horace Clue
54.00
52.10
47.90
2007
Joseph Hibbert
Mikael Phillips
60.9
50.62
48.98
2011
Damion Crawford
Joan Gordon-Webley
58.31
50.68
49.32