


 14 / 18

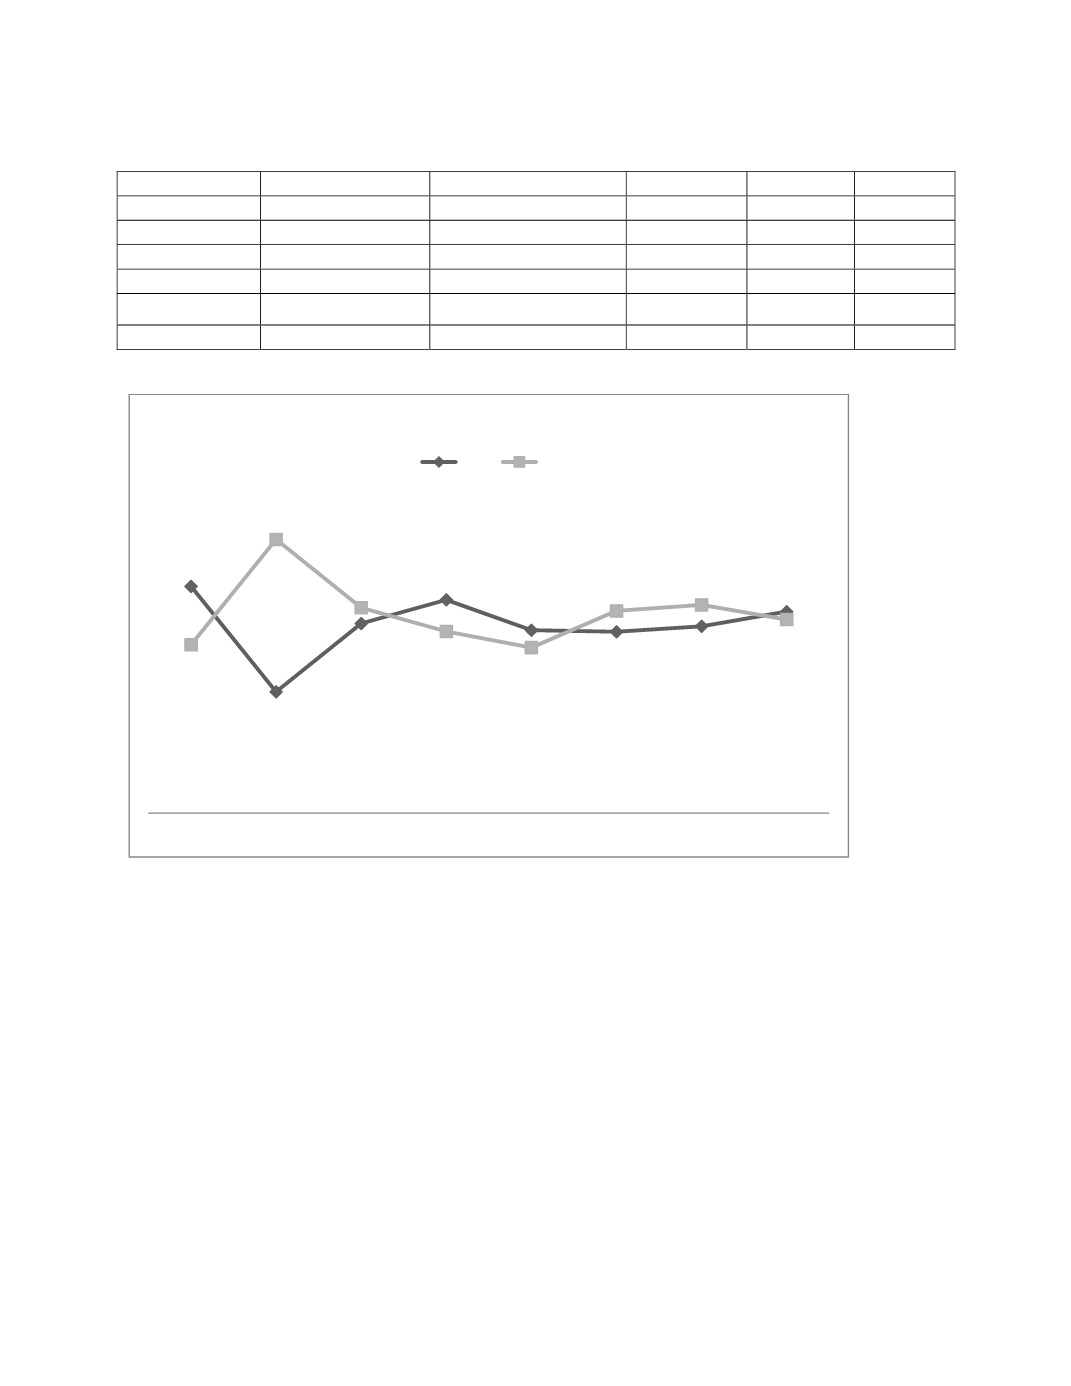
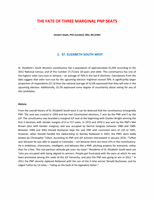
Table 4: Share of Seat Occupation over the Past 6 Elections
Year
Winner
Loser
Turnout
% winner
% Loser
1989
Edmund Bartlett
Oswald Seymour
74%
51.96
48.04
1993
Collin Campbell
Edmund Bartlett
63%
53.97
46.03
1997
Collin Campbell
Percival Broderick
63%
46.34
41.93
2002
St. Aubyn Bartlett
Collin Campbell
56%
51.18
45.86
2007
St. Aubyn Bartlett
Trevor Munroe
63%
52.67
47.33
2011
Andre Hylton
Sapphire Longmore
57%
50.98
49.02
57.4
30.7
48
54
46.3
45.9
47.3
51
42.6
69.3
52
46
41.9
51.2
52.7
49
1976
1980
1989
1993
1997
2002
2007
2011
Chart 11: Voting Trends 1976 to 2011 in St. Andrew Eastern
PNP
JLP
Demographics: No Clear Advantage for any Party
The data in Chart 12 show the complexity of the St. Andrew Eastern constituency. Note that the sample
was cut precisely to match the households of each area. Unlike the previous 2 marginal seats studied,
there are no very large community or sector that must be controlled in order to win the seat. The
candidate must try to have an advantage in all or most in order to do well. Certainly Papine (Hope
Tavern, Skyline, Papine road to Gordon Town), Mountain View Road (Hampstead Park, Saunders Road,
Jarrett Lane), and August Town are demographically critical – but they do not make up 50% of the
constituency. This layout affects both performance and mobilization. The other critical demographic
variable is income differences. The constituency range from extreme poverty and unemployment, and