


 2 / 11

The PNP entered the 2016 General Election with 42 seats of which 14 were marginal. Of this number the
study done between December 2015 and January 2016 recognized that 6 were in trouble. These are
highlighted in yellow in Table 2. The PNP lost the election because the JLP was able to win 9 of the 14
marginal seats, as well as 2 of the near‐marginal ones – leaving the PNP with only its core seats and a
small number of near‐marginal survivors. The PNP had 12 ‘impenetrable’ seats in 2011. These are
defined here as having traditional wins above 33% difference. The ‘Why Jamaicans Vote’ study found
that over the period between the last 2 elections the PNP expanded these to 26 core/impenetrable PNP
seats, suggesting that they needed to shadow box and beat themselves to lose – which they did.
Examination of the data in the report shows that they did not lose any of these. In fact, notes exchanged
with the pollsters showed that they too found these 26 seats that were too deeply entrenched PNP to
swing. So why could they not find 6 more seats to win; and even more important, which pollster could
predict that the PNP could not find just 6 more seats out of the other 16 they had? The PNP’s nightmare
is that they only clung to 5 from the 16!
Examination of the 2011 and 2016 data show that something happened that eroded over 10% of the
PNP’s vote. In fact, I was able to identify this while the votes came in on the night of the election. Notice
in Table 2 that of the 42 seats the PNP occupied before the election, only 6 (14%) were not eroded.
These are highlighted in blue. In other words, something happened that eroded the entire PNP base.
There was no significant difference between core constituencies and others. The average erosion of the
12 core seats the PNP had in 2011 was 11.1%, and the average for other seats was 10.0. The only reason
the PNP lost the marginal seats is simply arithmetical. In other words, the data do not show any
awesome strategy by the JLP to focus on the marginal seats. The data show that all PNP seats got
affected. There are also no differences when the data are aggregated from the ‘Why Jamaicans Vote’
data.
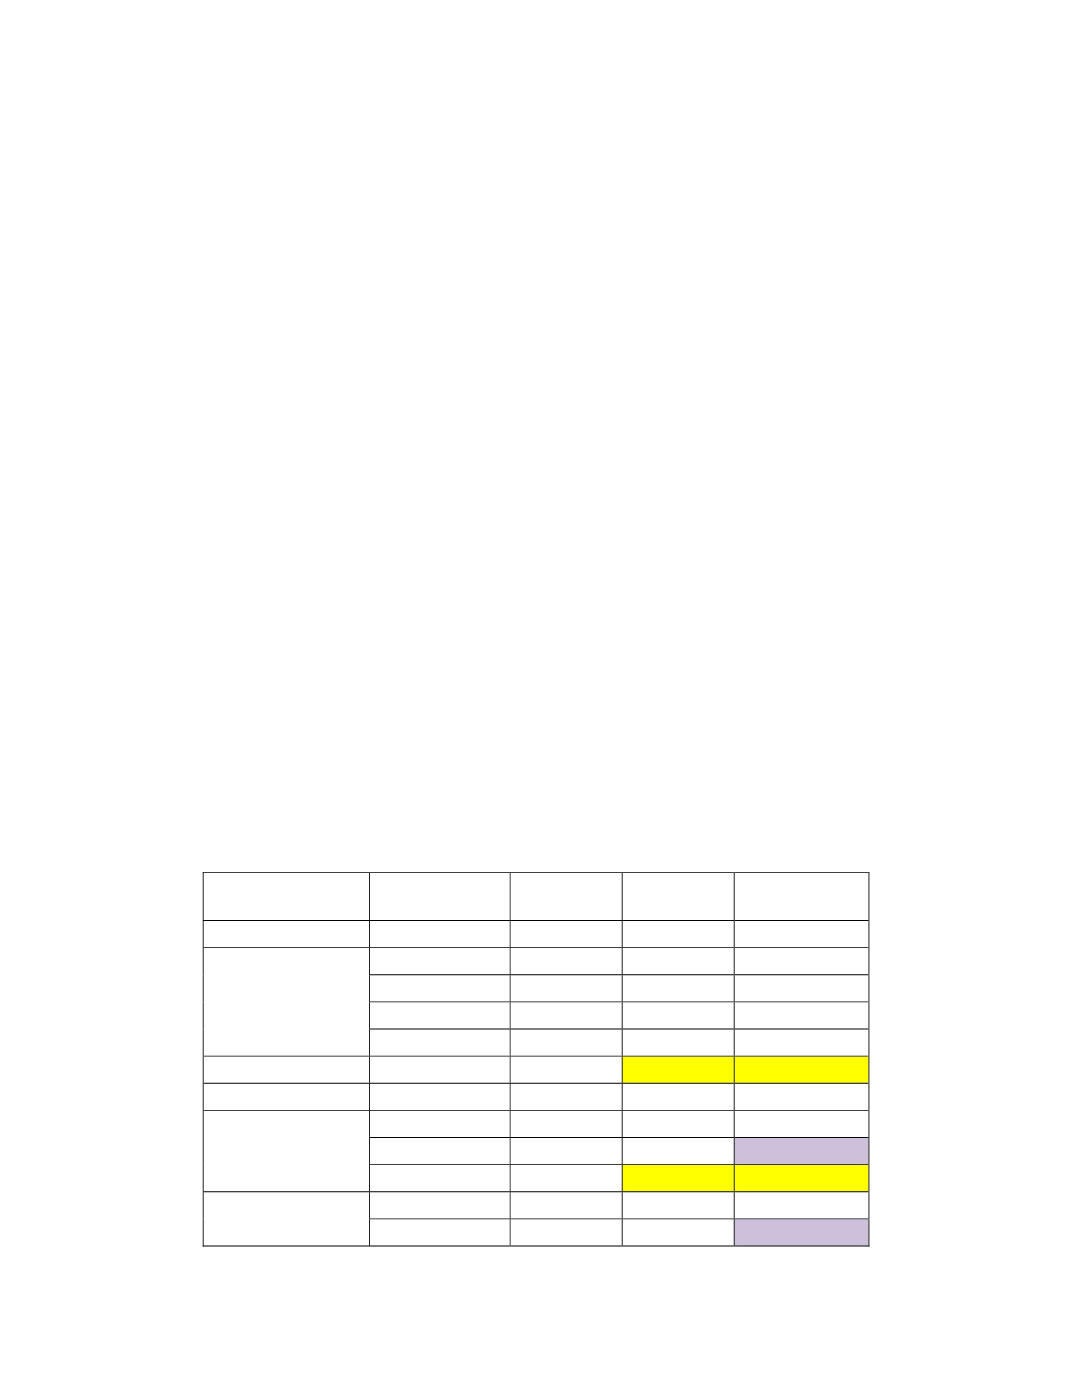
Table 1: JLP Transition between 2011 and 2016
PARISH
CONSTITUENCY
2016 VOTE
2011 %
WIN
DIF
Kingston
KW
83.5
80
3.5
St. Andrew
ANC
41
37
4
ANE
39
35
4
ANW
38.4
25
13.4
AWC
26
13.2
12.8
St. Thomas
TW
4
3.6
0.4
St. Eizabeth
ENW
15.5
15.2
0.3
Clarendon
CLC
57.1
42.3
14.8
CLNC
8.4
27.6
‐19.2
CLSE
9.5
1.2
8.3
St. Catherine
CC
76.5
71
5.5
CNE
2
10.6
‐8.6