


 5 / 22

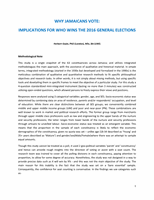
52.6
22.8
24.6
45.9
25.2
28.9
58.7
20.5
20.8
YES
NO
UNCERTAIN
Chart 3: Voting Profile by Age
AVERAGE YOUNG MATURE
65.4
58
56
51.4 48.4 47.3 45.7 42.3
Mature
PN Males
Mature
UM Males
Mature
PN
Females
Mature
UM
Females
Young PN
Males
Young
UM
Females
Young
UM Males
Young PN
Females
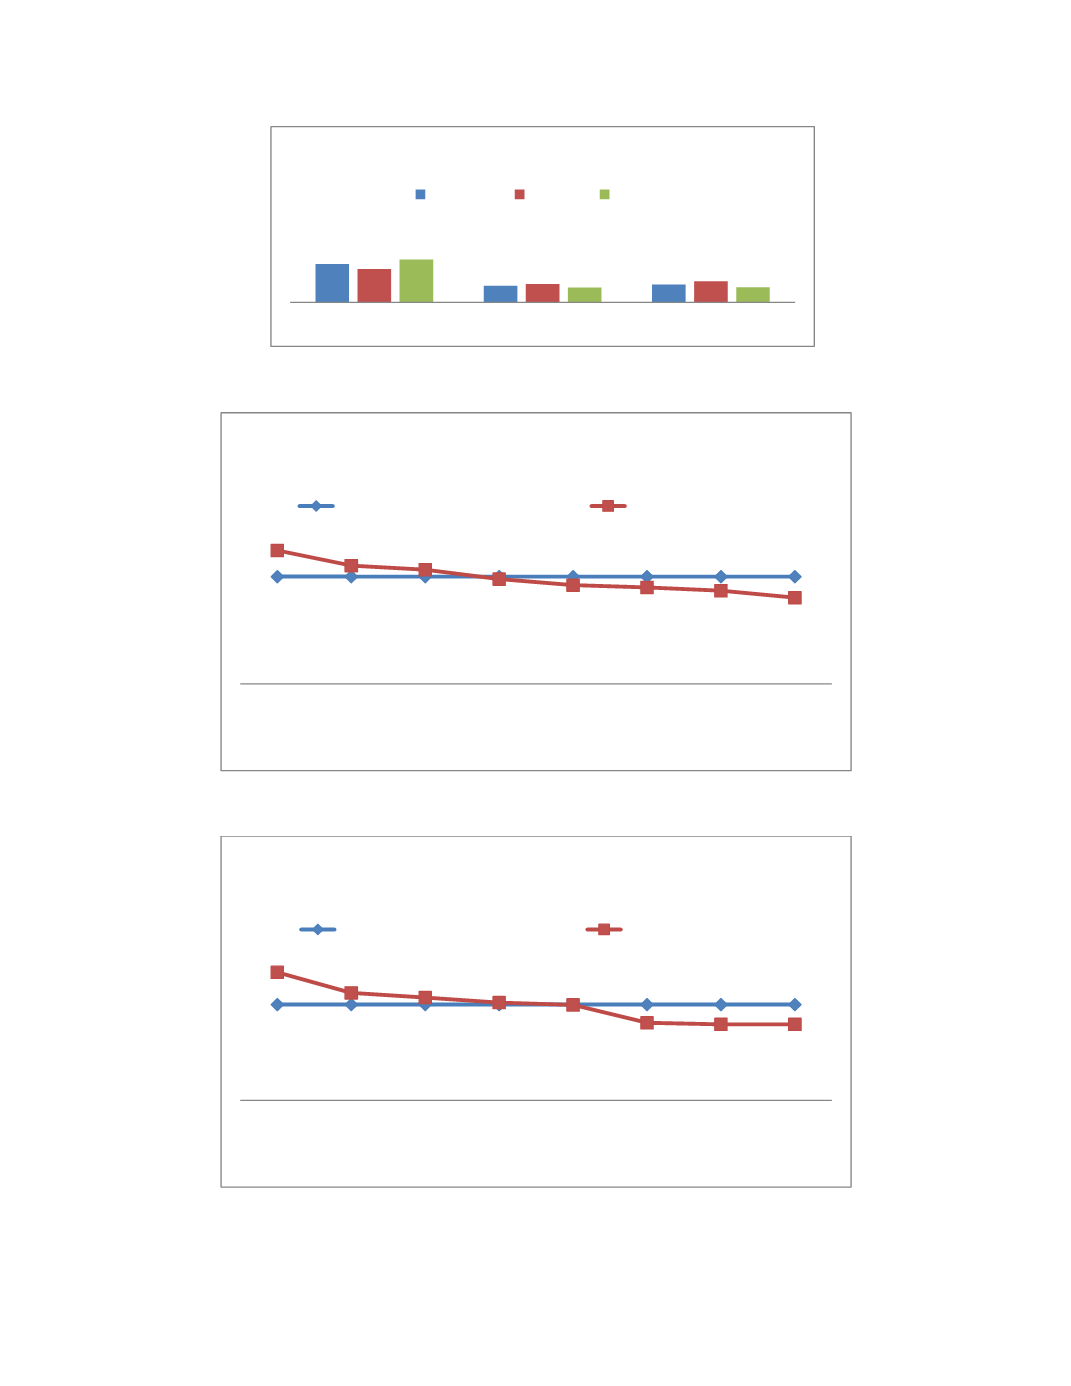
Chart 4: Gap Analysis Showing Multivariate Data on Yes
Voting by Age, Sex and SES combined
AVERAGE YES VOTING (52.6%)
ACTUAL YES VOTING
33
27.7 26.5 25.2 24.6
20
19.6 19.6
Young PN
Males
Young
UM Males
Young PN
Females
Young
UM
Females
Mature
UM Males
Mature
PN
Females
Mature
UM
Females
Mature
PN Males
Chart 5: Gap Analysis Showing Multivariate Data on
Uncertainty by Age, Sex and SES combined
AVERAGE UNCERTAIN(24.7%)
ACTUAL UNCERTAIN
5