


 4 / 22


multivariate data. It shows that mature respondents (35 years and over) are the most likely to vote,
especially if they are males and poor or near‐poor. Young people, especially females are the least likely
to vote in the upcoming election. They express the greatest political apathy. In the study researchers
‘pushed’ respondents to say why they felt uncertain, and to suggestwhat might motivate them to vote.
These were counted as half votes – given uncertainty can swing to a vote or no vote. Chart 5 shows that
young people are not only more likely to express apathy, but also uncertainty – starting with poor and
working class males. They complained that neither PNP or JLP focused on helping young men in Jamaica.
The least uncertain potential voters are the working class and poor ‘die‐hard’ males.
This means that
candidates/parties can increase their chances at the polls by campaigning to disgruntled youth,
especially males; nonetheless mature voters provide greater guarantees.
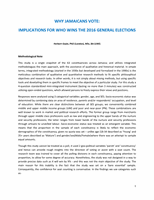
Table 2: Are you going to vote?
Frequency
Percent
Valid Percent
Cumulative
Percent
Valid
yes
656
52.6
52.6
52.6
no
284
22.8
22.8
75.3
uncertain
308
24.7
24.7
100.0
Total
1248
100.0
100.0
52.6
22.8
24.6
53.2
21.9
24.9
51.4
24.4
24.2
YES
NO
UNCERTAIN
Chart 1: Voting Profile by SES
AVERAGE PN UM
52.6
22.8
24.6
55.4
18.3
26.3
49.4
27.8
22.8
YES
NO
UNCERTAIN
Chart 2: Voting Profile by Gender
AVERAGE MALES FEMALES
4