


 3 / 22


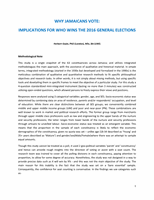
Table 1: Sample by Sex, SES and Age
Age of Respondent
Sex
Total
male
female
18-34
Soci-economic Status
pn
221
189
410
um
94
91
185
Total
315
280 595 (48%)
35+ years Soci-economic Status
pn
208
200
408
um
138
107
245
Total
346
307 653 (52%)
Total
Soci-economic Status
pn
429
389 818(66%)
um
232
198 430 (34%)
Total
661 (53%) 587 (47%)
1248
FINDINGS
The study was designed to address the core research objectives:
•
To estimate the proportion of persons on the ‘voters list’ who will vote in the upcoming
election;
•
To assess Jamaicans’ main motivations to go and vote;
•
To analyze what Jamaicans like most and least about the JLP and PNP, and thus be able to
predict their voting intentions.
Attitude to Political Participation and Voting in the 2016 General Election
The data displayed in Table 2 show that between November 15, 2015 and January 10, 2016 just over a
half of Jamaicans who are on the ‘Voters List’ expressed that they intend to vote in the 2016 General
Election. Approximately 23 percent stated that they had no intention of voting and a quarter expressed
uncertainty. Charts 1 to 3 show that the most critical variable that explains whether or not a Jamaican
will vote is Age/maturity; followed by gender, and least SES. Chart 4 is a gap analysis that provides
3