


 20 / 22


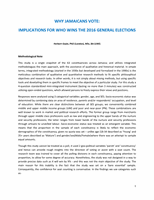
Voting Predictions
Chart 15 suggest that when all predicted votes are tallied (treating ‘Might’ votes as halves and
accounting for the fall out) the PNP are likely to get 33% of the popular votes compared to the JLP’s 27%
‐ putting the PNP 6% points ahead of their opponents. The data displayed in Chart 16 show that the PNP
are likely to have 12 clear wins (50% or more difference), a clear advantage (33‐49% difference) in 14
constituencies, and can arrest another 10 in which they have a mild advantage (15‐32% difference). The
tally of these (36 seats) suggests that the PNP are almost guaranteed a win in the upcoming election –
barring a Major social shift. Without the unclear seats the JLP is expected to amass only 18 seats. They
are therefore expected to drive a hard campaign in order to give themselves a chance. The stringent
sampling did not allow us to predict the remaining 9 seats. Table 4 provides a breakdown of all 63
constituencies.
33%
27%
10%
30%
Chart 15: Predicted Votes for PNP and JLP
PNP (345 Yes + 129 Might/64 = 409)
JLP (388 Yes + 106 Might/53 = 341)
Estimated fall‐out from Might Vote (65 = 53) = 118
Other (Not/302, Cannot say/70, vote only for sale/8) = 380
12
14
10
4
11
3
9
CLEAR WIN
ADVANTAGE MILD ADVANTAGE
UNCLEAR
Chart 16: Summary of Predicted Votes by Constituencies
PNP JLP UNCLEAR
20